Sask Landing Walleye Tournament Statistics 2005-2024
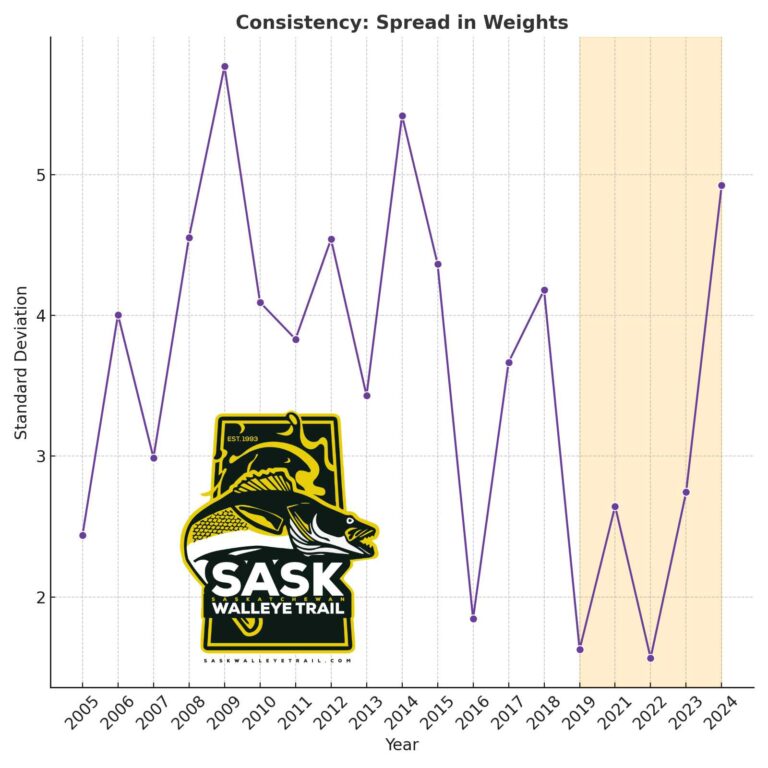
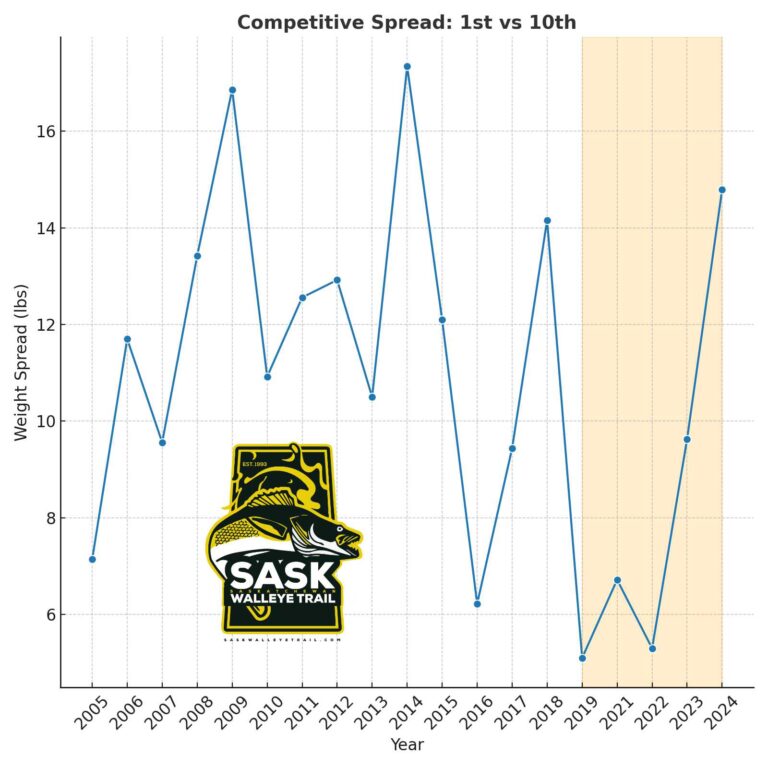
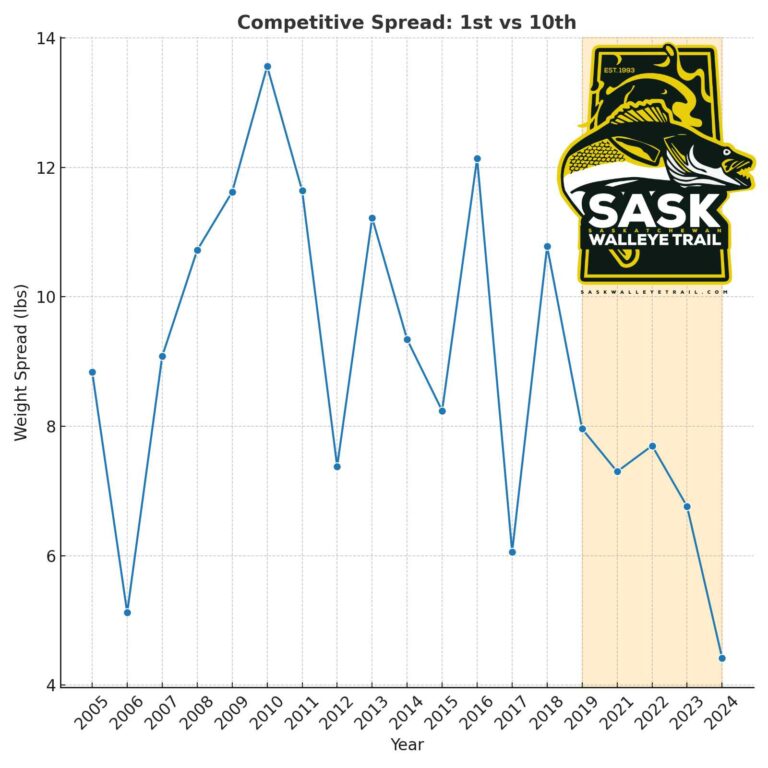
🎯 Competitive Spread (1st vs 10th) 📏 This shows the gap between 1st and 10th place weights. Smaller spread = tighter leaderboard. Bigger spread = domination by the top team. #SaskLandingWalleye #SaskWalleyeTrail #FishingTournament #CommunityEvent #BigFish #SaskatchewanFishing #KyleSK #LakeDiefenbaker #SaskWalleyeTrail #SaskFishing…